Exporting Matplotlib Plots to LaTeX
This blog post explains how plots from matplotlib can be exported to PGF files, which in turn can be imported into $\LaTeX$ documents. The full source code can be found in the appendix.
Motivation
Skip this part if you are already motivated, i.e. you know why you would want to export from matplotlib to LaTeX.
Suppose you have a Python script that produces a nice plot using matplotlib. You might save the plot with
plt.savefig('histogram.png', dpi=400)
and it will write a PNG file to the disk, which is ~141 KB in size (in the example).
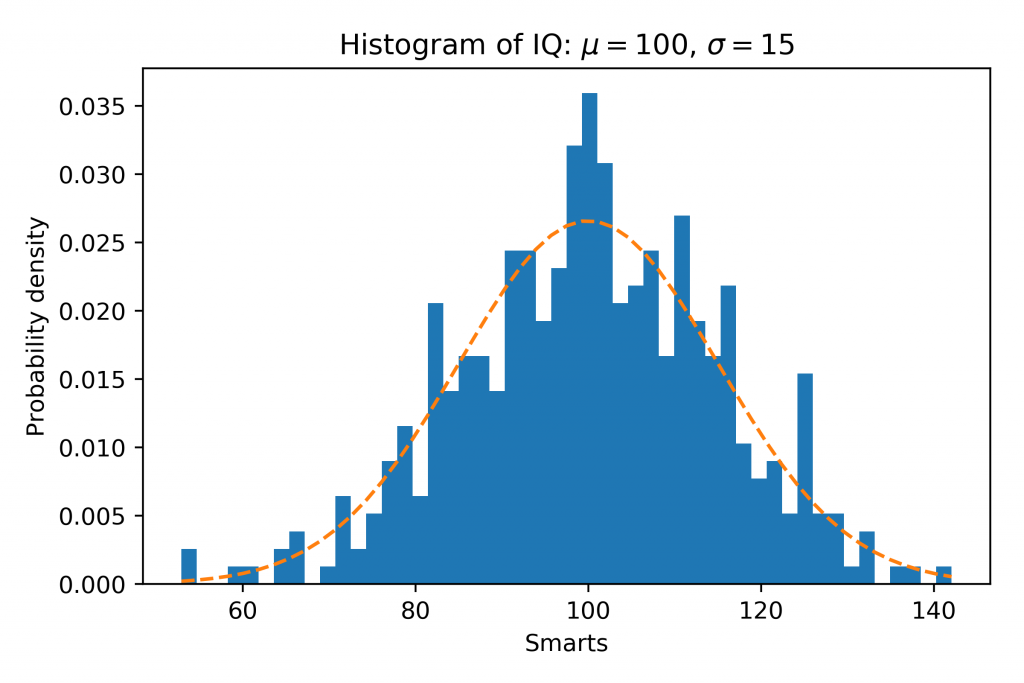
However, importing this file as an image into a LaTeX document has some drawbacks. Most notably that
- the fonts of the document do not match the axes labels,
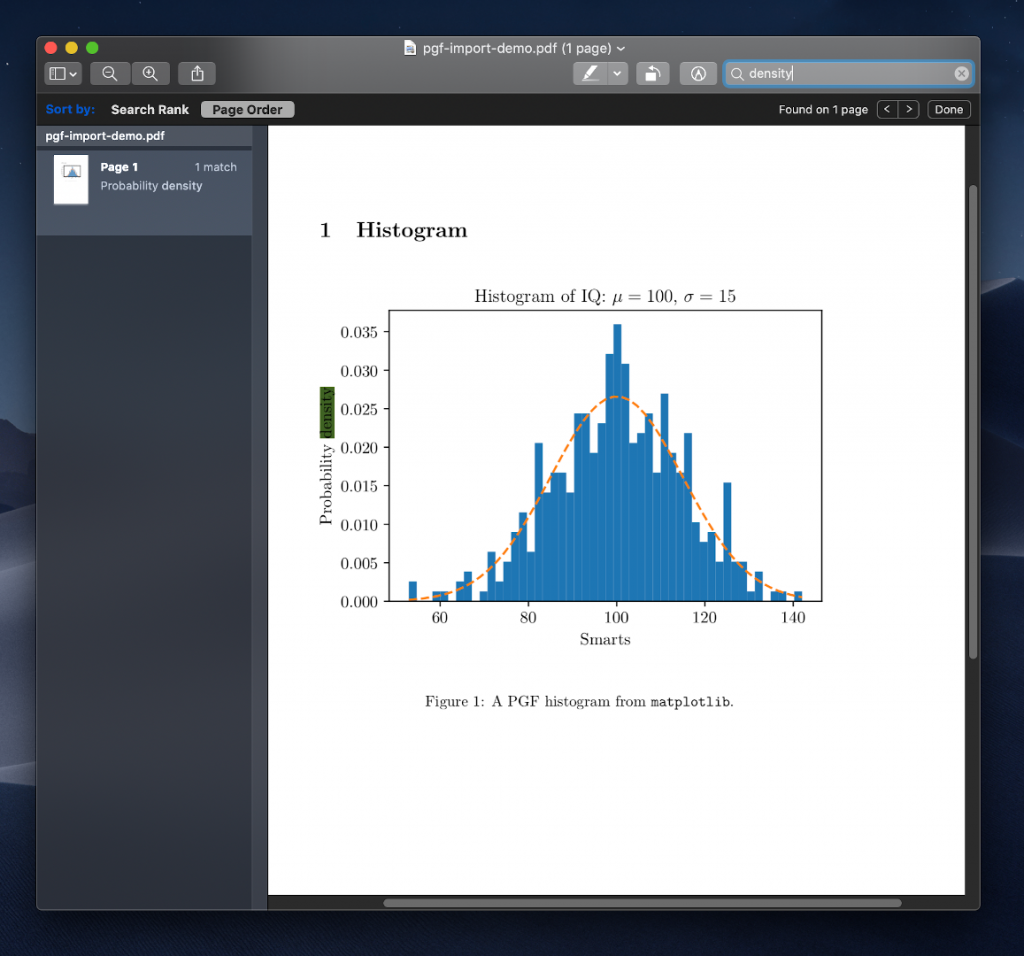
- the text is not searchable (“probability density” would not be found with
ctrl+f), - the image gets blurry when the reader zooms in, and
- it is comparably large in file size.
The solution to all four problems is exporting a PGF file from matplotlib, so LaTeX itself can take care of rendering the figure.
Exporting Matplotlib Plots
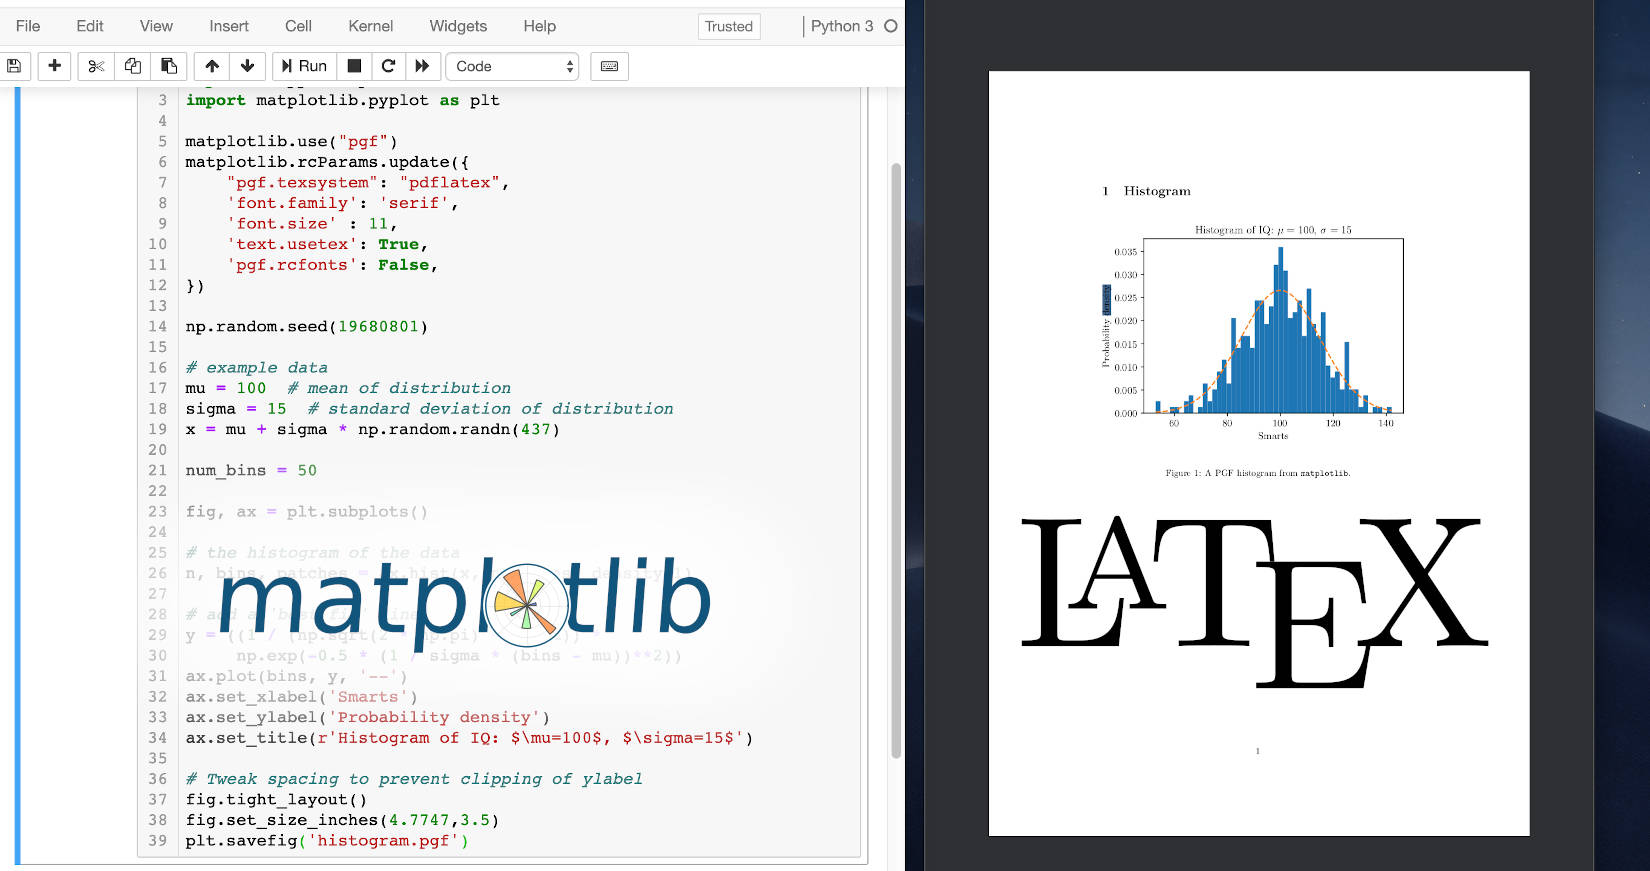
Adjust your matplotlib script by adding the following lines after import matplotlib:
matplotlib.use("pgf")
matplotlib.rcParams.update({
    "pgf.texsystem": "pdflatex",
    'font.family': 'serif',
    'text.usetex': True,
    'pgf.rcfonts': False,
})
Update the save command to write to .pgf
plt.savefig('histogram.pgf')
and make sure LaTeX is installed on the system. The command pdflatex is needed. On Mac brew cask install mactex does the job.
Running the script will output the histogram file in PGF format which can be imported with LaTeX.
Importing PGF with LaTeX
Place the PGF file in the LaTeX project folder and import it with the following code:
\begin{figure}
    \begin{center}
        \input{histogram.pgf}
    \end{center}
    \caption{A PGF histogram from \texttt{matplotlib}.}
\end{figure}
The figure will appear in the document.
Adjusting the Plot Size
The PGF figure might be scaled undesirably, e.g. it can be too wide. In that case I found it helpful to determine the text width \textwidth of the document with the command
\usepackage{layouts}

[...]

\printinunitsof{in}\prntlen{\textwidth}
and adjust the matplotlib figure based on that:
fig.set_size_inches(w=4.7747, h=3.5)
Scaling with matplotlib is better than scaling the entire PGF figure because the font sizes remain the same and match the text in the document.
References
- Blog post on the same topic by Sebastian Billaudelle
- TeX StackExchange Answer by blahdiblah: determining the text width in a document
- StackOverflow answer by Elenium: matplotlib rcParams configuration
- Matplotlib examples: histogram plot used in this post
Appendix
Python code used to generate the histogram:
import matplotlib
import numpy as np
import matplotlib.pyplot as plt

matplotlib.use("pgf")
matplotlib.rcParams.update({
    "pgf.texsystem": "pdflatex",
    'font.family': 'serif',
    'font.size' : 11,
    'text.usetex': True,
    'pgf.rcfonts': False,
})

np.random.seed(19680801)

# example data
mu = 100  # mean of distribution
sigma = 15  # standard deviation of distribution
x = mu + sigma * np.random.randn(437)

num_bins = 50

fig, ax = plt.subplots()

# the histogram of the data
n, bins, patches = ax.hist(x, num_bins, density=1)

# add a 'best fit' line
y = ((1 / (np.sqrt(2 * np.pi) * sigma)) *
     np.exp(-0.5 * (1 / sigma * (bins - mu))**2))
ax.plot(bins, y, '--')
ax.set_xlabel('Smarts')
ax.set_ylabel('Probability density')
ax.set_title(r'Histogram of IQ: $\mu=100$, $\sigma=15$')

# Tweak spacing to prevent clipping of ylabel
fig.tight_layout()
fig.set_size_inches(4.7747,3.5)
plt.savefig('histogram.pgf')
LaTeX code used to generate the PDF document shown in the screenshot:
\documentclass[a4paper]{article}
\usepackage[utf8]{inputenc}

\usepackage{tikz}
\usepackage{tikz-cd}
\usepackage{pgfplots}
\pgfplotsset{compat=1.14}

\begin{document}

\section{Histogram}

\begin{figure}[h]
    \begin{center}
        \input{histogram.pgf}
    \end{center}
    \caption{A PGF histogram from \texttt{matplotlib}.}
\end{figure}

\end{document}