Vision-based Page Rank Estimation with Graph Networks
As part of our Bachelor studies, Samed Güner and I worked on a student research project on vision-based page rank estimation. In this blog article we share our work on a non-technical level. The accompanying written report contains all the technical and mathematical details on more than 100 pages.
Open PageRank is an initiative that allows for easy comparison of domain ranks. What does that mean? It provides a list of the top 10 million websites ordered by rank. The most popular ones are fonts.googleapis.com, facebook.com, youtube.com, twitter.com, google.com, plus.google.com, instagram.com, linkedin.com, s.w.org, and pinterest.com. The list keeps going; rank #1,070,876 is, for instance, tools.timodenk.com (as of May 2019).
The list of Open PageRank uses the number of backlinks to a domain as a ranking criterion. One might consider different ranking methods, e.g. the look of a web page. We were wondering whether the rank of a domain can be inferred from the visual appearance of its web pages. Put differently: Could one guess the rank of a page just by looking at it? Maybe there is a correlation between good look and high rank? Figure 1 illustrates that this is certainly not always the case.
![]()
Imagine the top 100,000 most popular domains were plotted in the diagram above. Every website would be a small point. Which shape would the point cloud have? Would it look like random noise or would it have an elliptical shape from top left to bottom right? The latter would indicate that web pages with a high rank are typically better looking than the ones with a low rank. A correlation would exist. To the best of our knowledge, this question is unanswered.
The difficulty in answering this question is that the look axis is a subjective measure and it’s hard to quantify 100,000 domains manually. Also, there might be other visual features that distinguish web pages from each other. Features that are unknown to us. We mitigate this problem by training a machine learning model to detect these visual features by itself. More specifically, the model is trained to predict the rank of a web page solely based on its look. The question is now slightly rephrased: We do not investigate the correlation between rank and good/poor look but the correlation between rank and anything about a web page’s visual appearance in general.
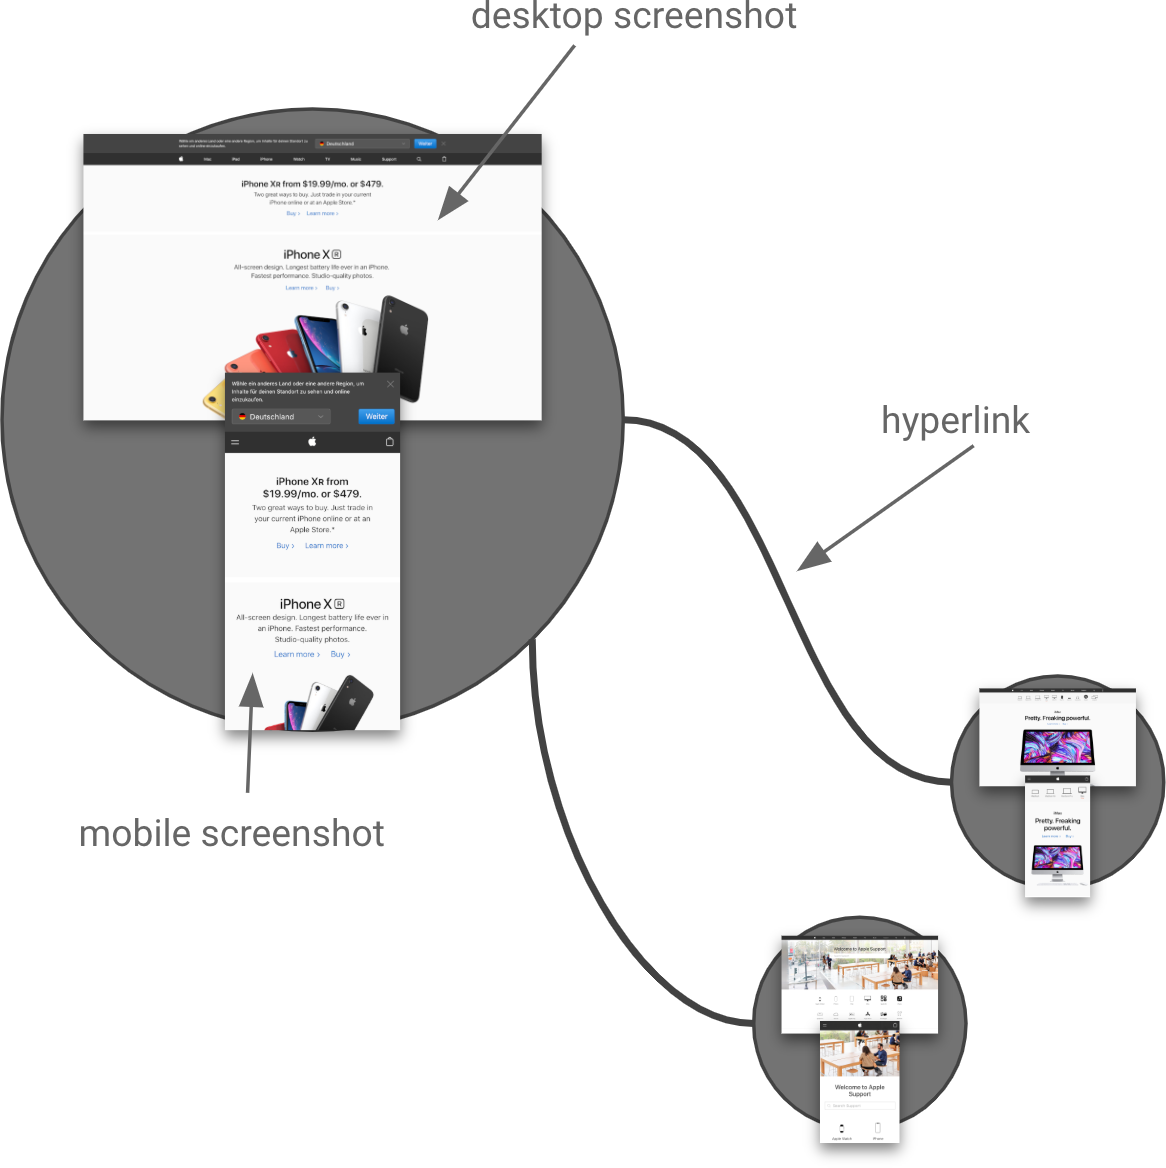
Training a model requires a dataset. For that sake we have developed a web crawler and made it visit the top 100,000 domains of the Open PageRank list. For each domain, it takes a screenshot of the landing page, follows some links, and takes up to eight screenshots of subpages of the same domain. In fact, we capture two screenshots per web page, one as it would look on a desktop device and one showing the page like mobile users would encounter it. Each domain can be seen as a graph: Nodes are web pages and the edges connecting them correspond to hyperlinks. Figure 2 shows such an excerpt of a graph for the domain apple.com (ranked #11).
The data crawler is developed in a modular way: It consists of modules, each of which is responsible for extracting certain information from a web page. One module takes a screenshot, another one determines the web page size in bytes, yet another one finds all hyperlinks of the page by looking through the HTML code.
After creating the dataset we have trained a combination of convolutional neural network (CNN) and graph network (GN) to predict the rank of a sample such as the one shown in Figure 2. The CNN is applied element-wise to all desktop-mobile-screenshot tuples in the graph, thereby converting the screenshot graph into a feature vector graph. The GN operates on the feature vector graph which is much smaller and easier to handle. We follow the GN definition of Battaglia et al. (2018). The GN outputs the rank estimation as a single scalar.
Instead of asking the model to take a single domain and predict its rank, we found it to be more stable to provide two domains and ask the model to rank the domains relative to each other. The model would see, e.g., bmx-videos.com (#46,170) and bundestag.de (#645) side-by-side and would have to rank bundestag.de above bmx-videos.com, just by looking at the screenshots of web pages of both domains. The exact loss term we use is derived from Burges et al. (2005). The side-by-side ranking is commonly referred to as pairwise ranking.
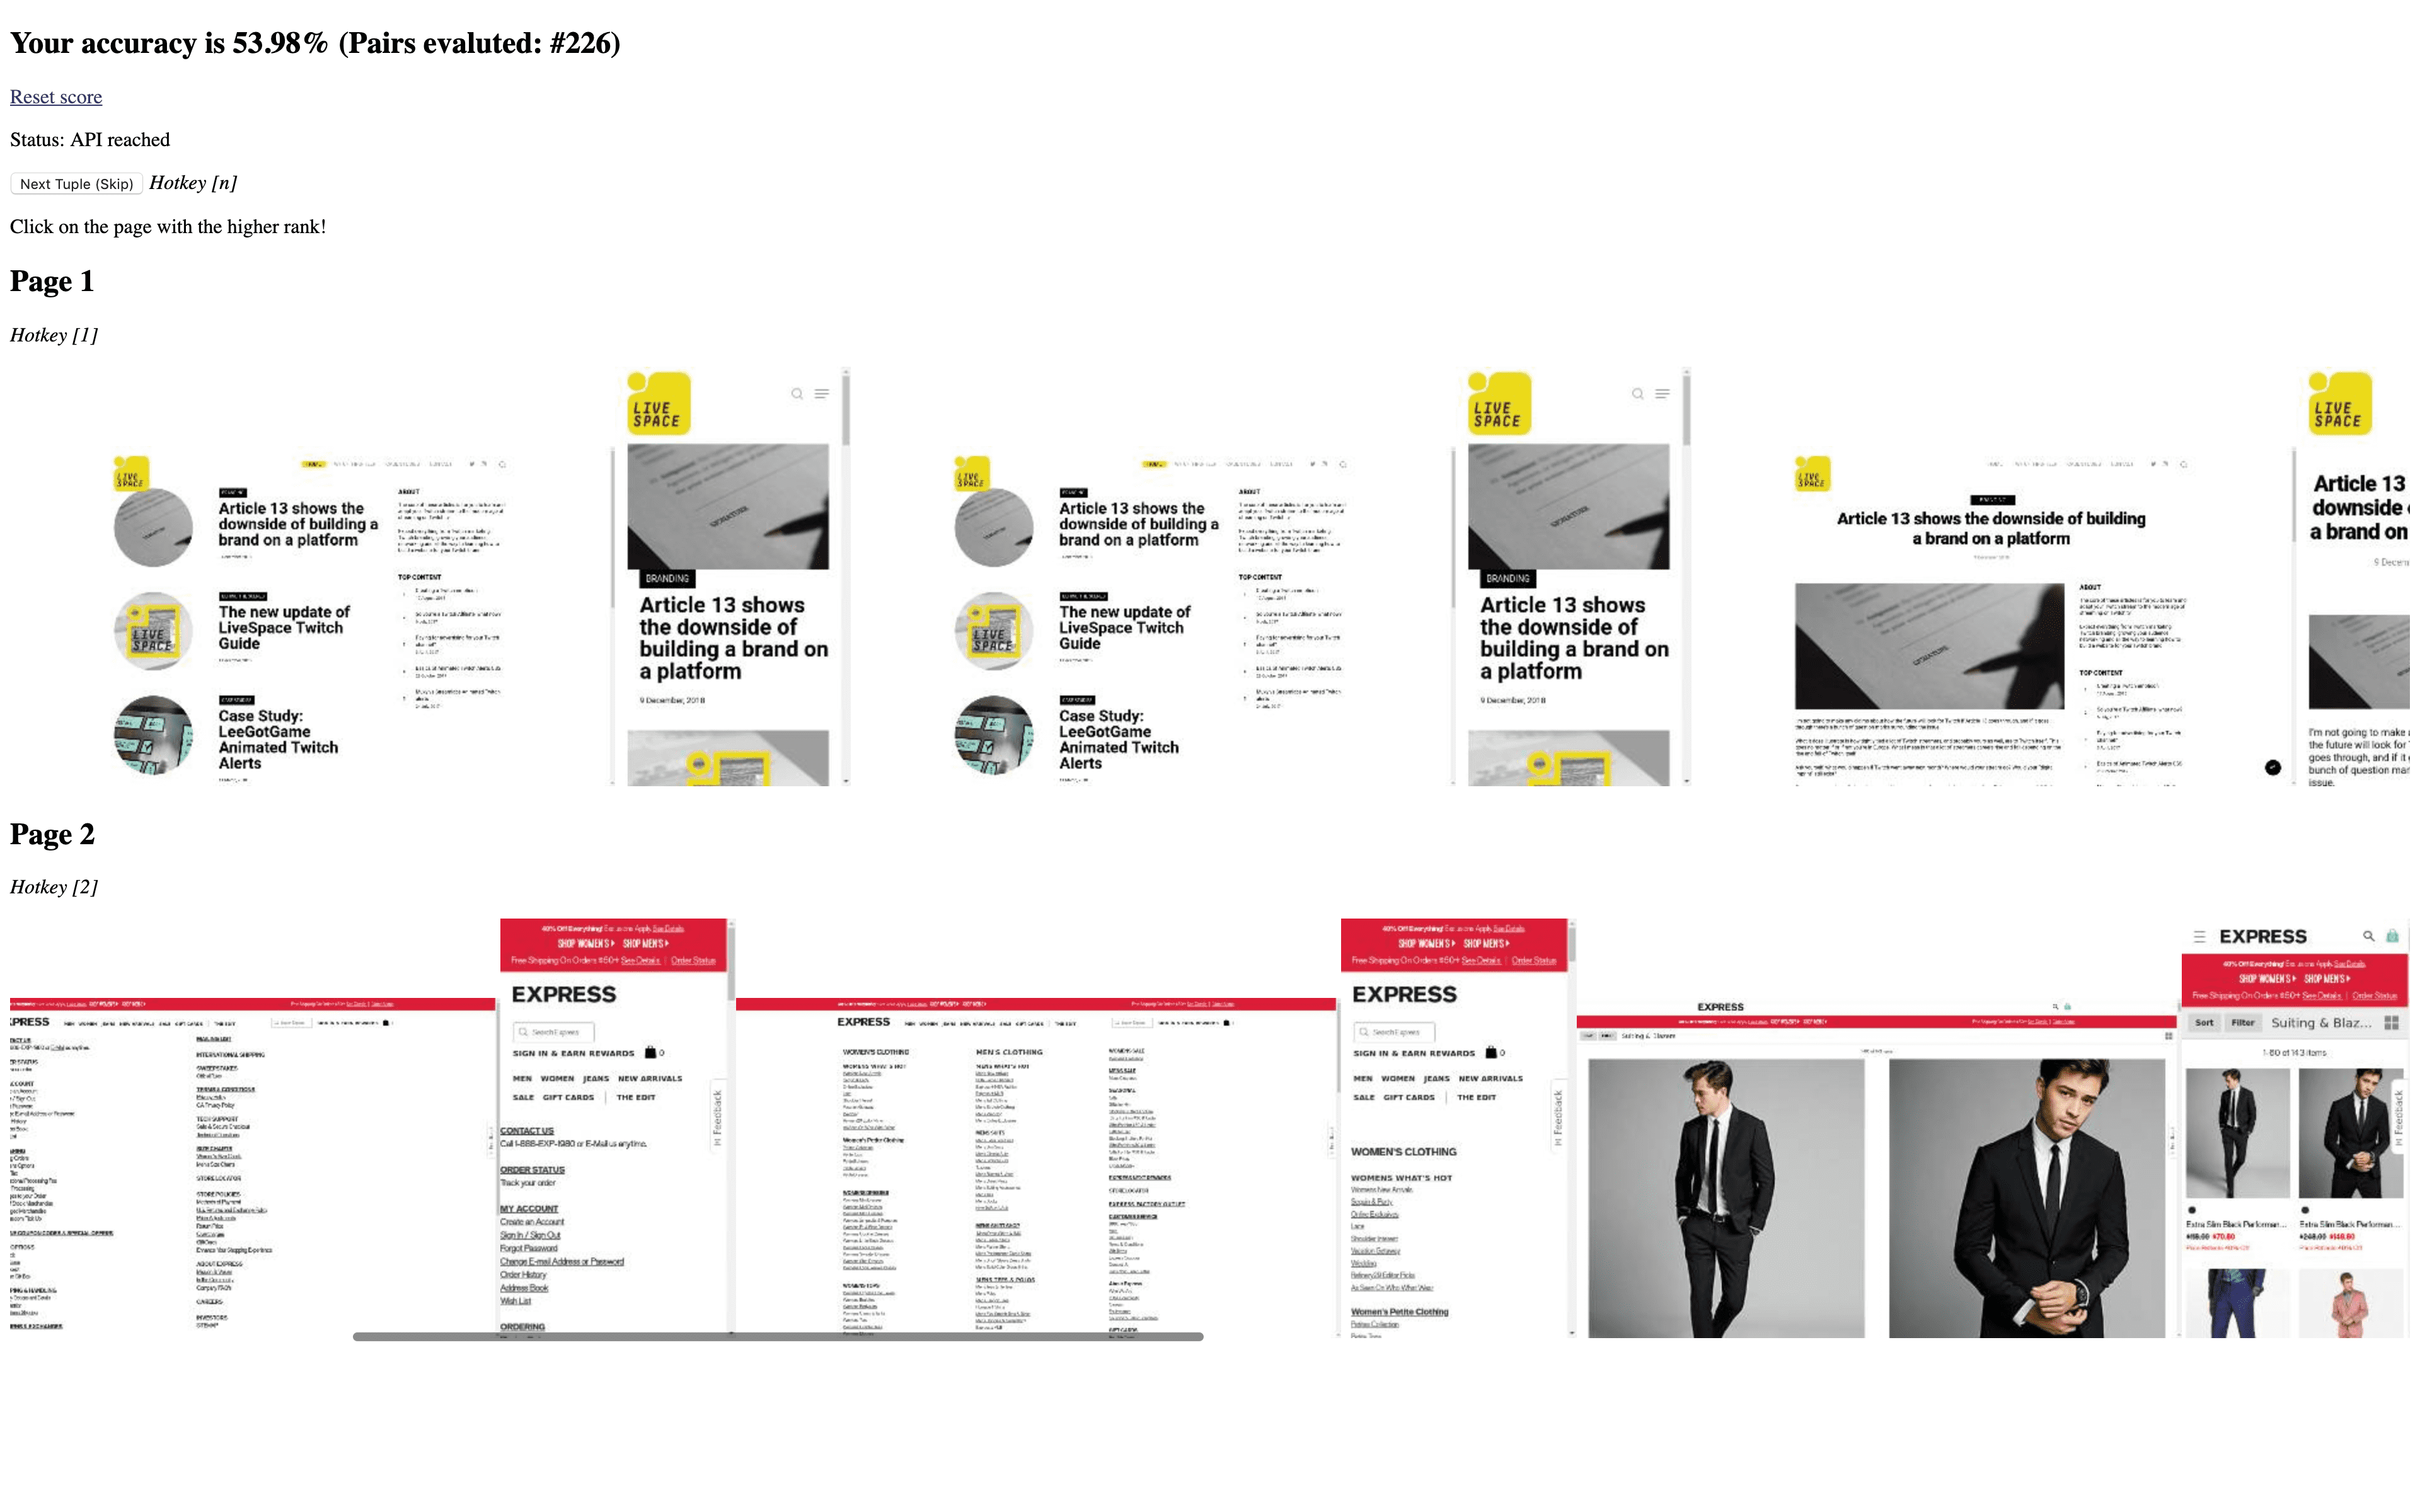
By random guessing, one would have an accuracy of 50% on the pairwise ranking task. Given two domains the chance of guessing the higher ranked one correctly is fifty-fifty. We have asked nine test subjects to do the pairwise ranking in a small web tool, developed for that purpose (see Figure 3 for a screenshot of the tool). On more than 1,000 domain tuples, the average human score is 57.8%. Our best performing CNN+GN model achieves 62.7% on a held-out test set, which is super-human performance!
Our work shows that a correlation between web page look and domain rank exists, therewith we answer an open research question. We quantify the strength of that correlation by achieving an accuracy of 62.7% on the pairwise ranking task. We release the 100k screenshot dataset publicly for future research. Furthermore, we open-source the code which includes the architecture of our models. If you are interested in more details, please continue by reading the written report.