Populating a Google Spreadsheet With Data From Google Calendar
This is a short technical explanation of how one can automatically populate a Google spreadsheet with data retrieved from a Google calendar. My concrete use-case is the following: I track my violin practice time in Google Calendar by adding an event every time I play. For example, on a Tuesday morning there would be a calendar entry called “Violin 🎻 Practice” from 08:00 to 09:00.
To make better use of that information I would like to see aggregated statistics: How long is a practice session on average? How many hours did I practice last week in comparison to the week before? These are only two examples of course. The approach is easily transferable to keeping track of one’s working hours, time spent commuting, sports, and so on.
Result
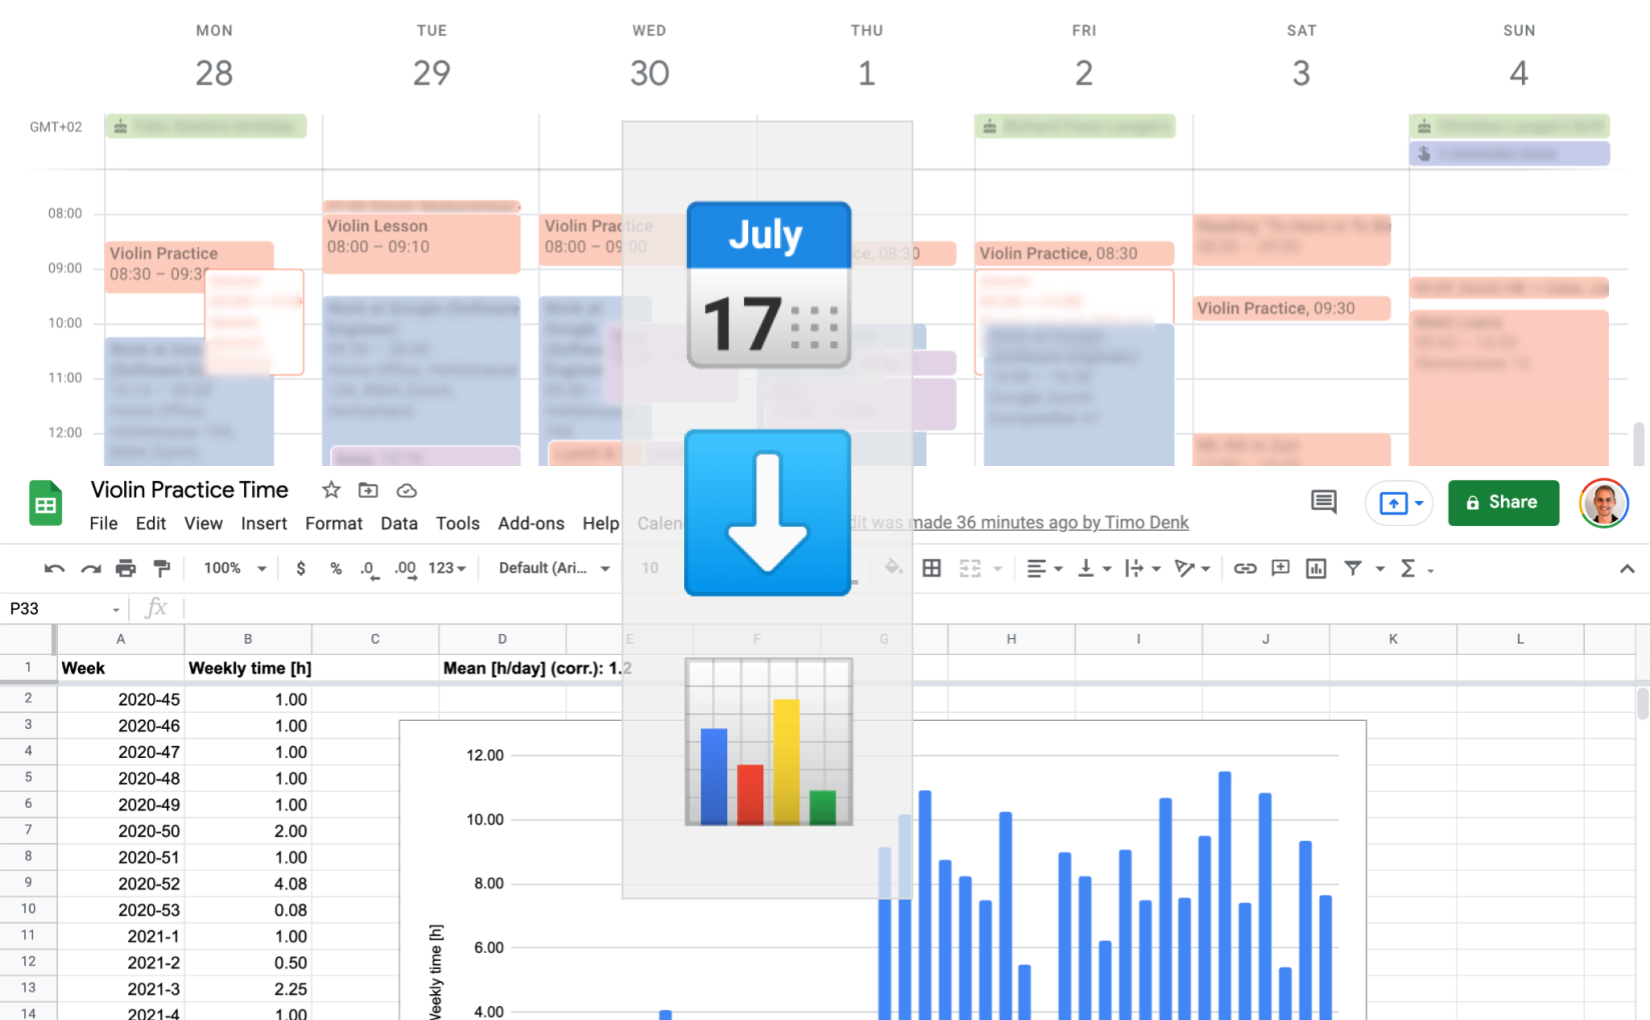
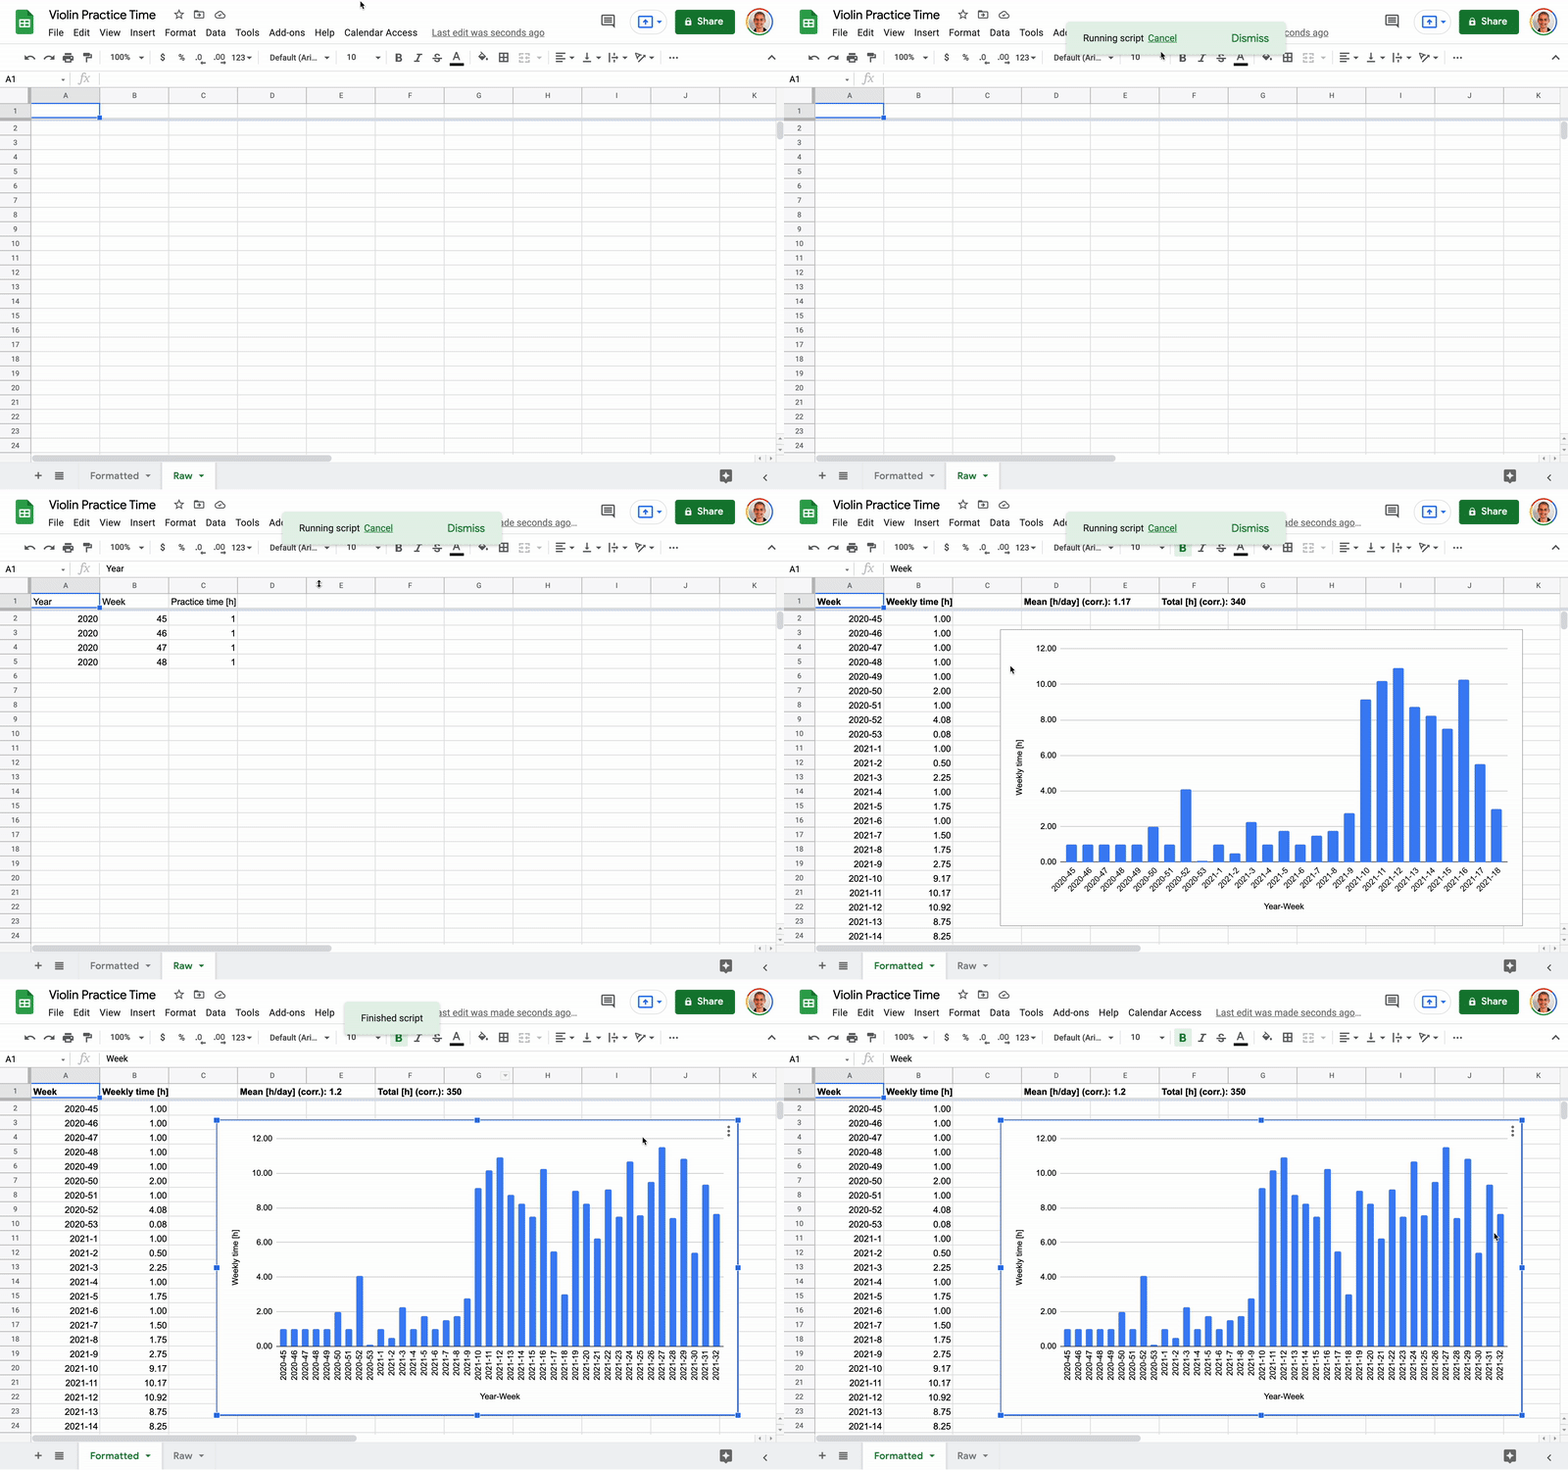
Before diving into the technical explanation, let’s look at the result of this project:


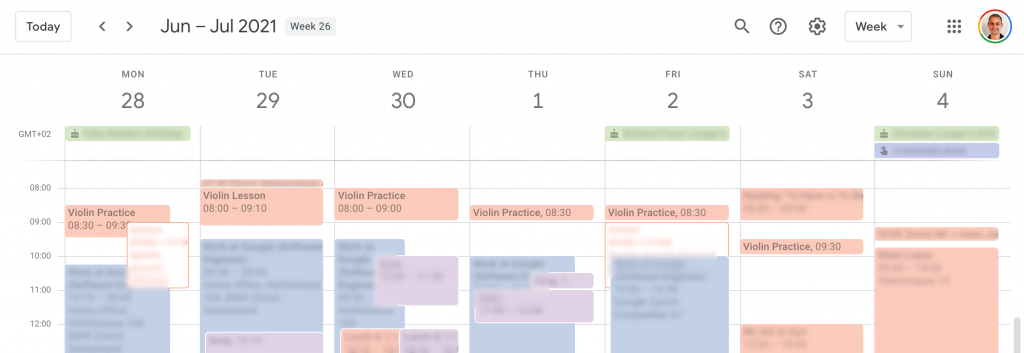
The calendar serves as the data source – so it must be kept up-to-date. Here all practice sessions are tracked. (They are the non-blurred events in the screenshot which shows a single week.)
Method
Note that this is not an end-to-end tutorial, but rather a solution sketch with pointers to the resources that helped me with setup and implementation.
One can add custom functions to Google Sheets. A tutorial on that topic can be found here. Google Sheets comes (just like Excel and others) with plenty of built-in functions. For example =AVERAGE(A1:A8) and the like. A custom function is basically offering one to use a self-written JavaScript implementation for such a function, so one can write =MY_FUNCTION() in the sheet and one’s own code gets invoked.
For the use-case at hand we’d like to have a function along the lines of =TOTAL_DURATION(start_date, end_date). Unfortunately – for permission reasons – custom functions do not work in combination with the Google Calendar API which is needed to read the events from the calendar. We therefore need a custom menu in which case the Calendar authentication works. A tutorial on custom menus is here.

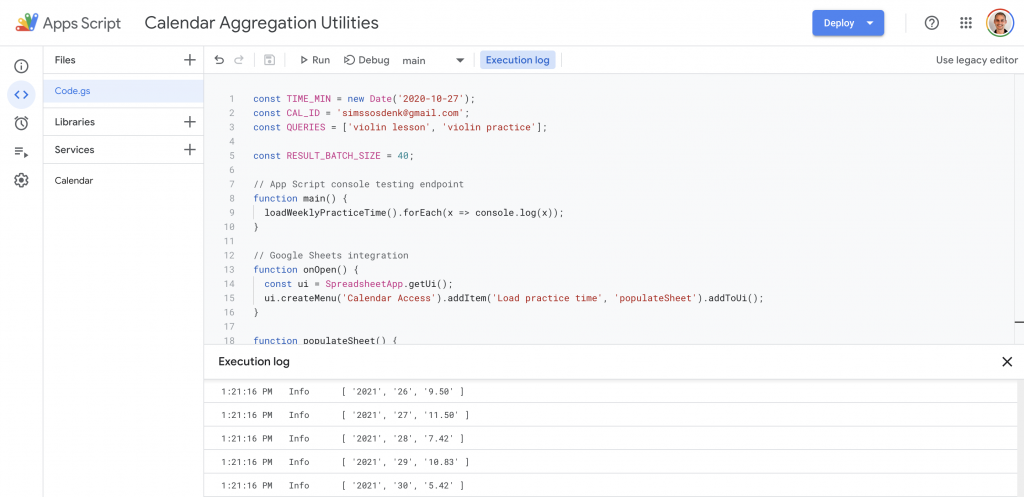
An entry in the custom menu invokes a JavaScript function. That function can access the Google Calendar API and can also modify the Google Sheet. In my violin example the function behind the custom menu clears the sheet, adds a header row, loads the practice time, and adds a new row for each week:
function populateSheet() {
  const sheet = SpreadsheetApp.getActiveSheet();
  sheet.clear();
  sheet.appendRow(['Year', 'Week', 'Practice time [h]']);
  loadWeeklyPracticeTime().forEach(x => sheet.appendRow(x));
}
I found it helpful to organize the sheet in such a way that one tab contains the raw data (so the script can clear that tab) and the other one is nicely formatted (where you saw the plot in the GIF above). That way one does not need to touch the JavaScript code when making changes to the spreadsheet visualizations. But where exactly is the code?

Conclusion
This post gave a short overview of how one can populate a Google spreadsheet using data from a Google calendar. I hope the links in combination with the source code (below) help readers write their own scripts for data crunching and fun/helpful analyses.